
Pulsed laser shearography with coherent fibre-optic imaging bundles
Why use a pulsed laser?
The multiple-illumination-direction shearography system built using continuous-wave (cw) DPSS lasers described previously only allows static measurements where a controlled strain is applied between the two camera frames required to make the shearography measurement. In situations where the test object is in motion or vibrating, or the applied strain is continually varying, a pulsed laser can be used to effectively freeze the motion of the object. This is because the laser pulse duration is typically significantly shorter than the camera exposure time (10s ns vs. 10s ms for a typical pulsed Nd:YAG system).
Multiple-observation-direction shearography
With the pulsed laser shearography system, the multiple measurement channels required to measure the orthogonal displacement gradient components are made up of multiple views of the surface of interest and a single illumination direction. The pulsed shearography system we built is illustrated in figure 1. A pulsed Nd:YAG laser is used as the optical source and A negative lens is used to diverge the laser light to illuminate the target forming a speckle pattern which is imaged by four camera lenses. Images collected by the four camera lenses are transported to the shearing interferometer by fibre-optic imaging bundles and are spatially multiplexed onto the four quadrants of a CCD camera. Spatial multiplexing allows for simultaneous acquisition of data from the four measurement channels, which is a requirement when analyzing dynamic test objects.
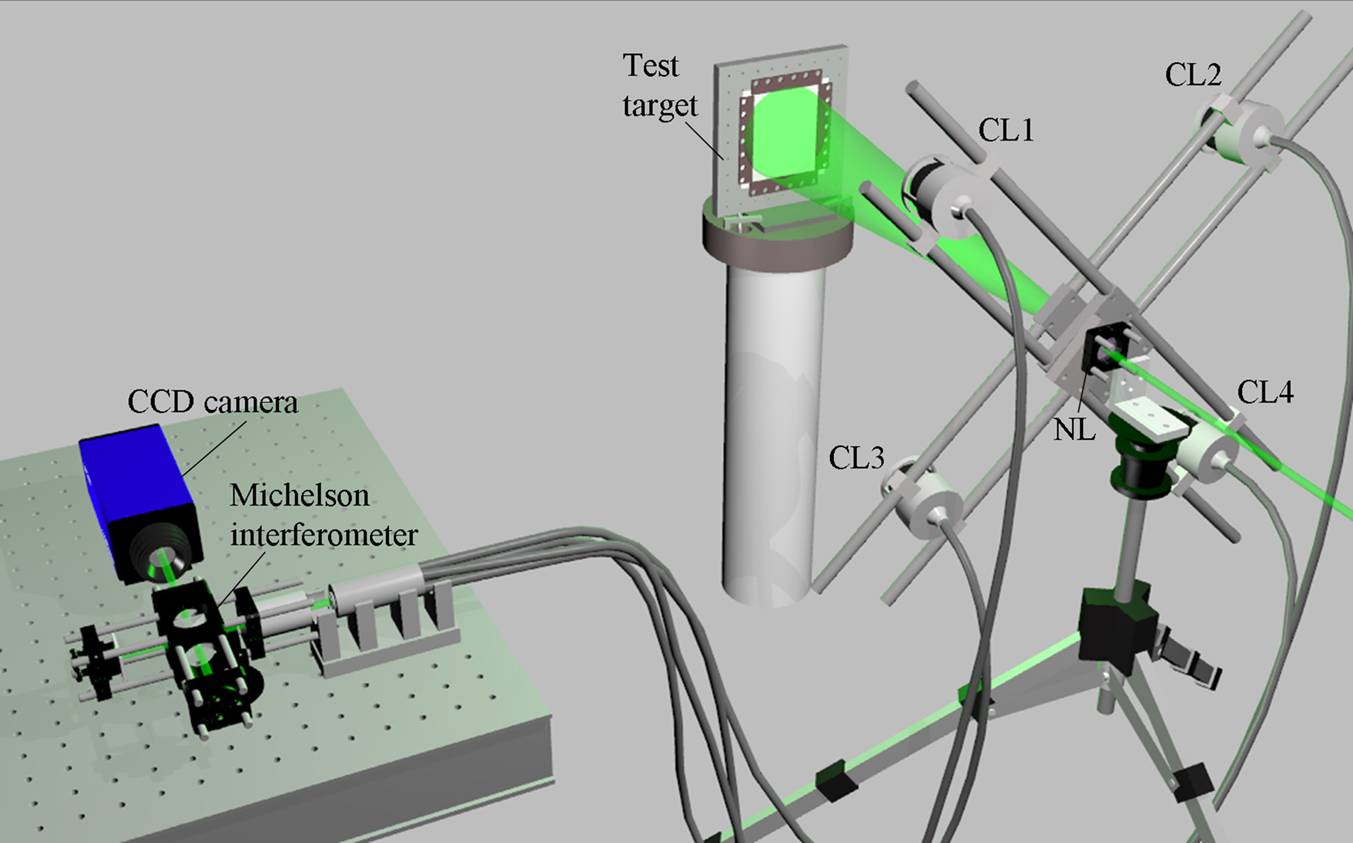 Figure 1 The multiple-observation-direction, pulsed laser shearography system incorporating fibre-optic imaging bundles. CL = camera lens, NL = negative lens.
Coherent fibre-optic imaging bundles
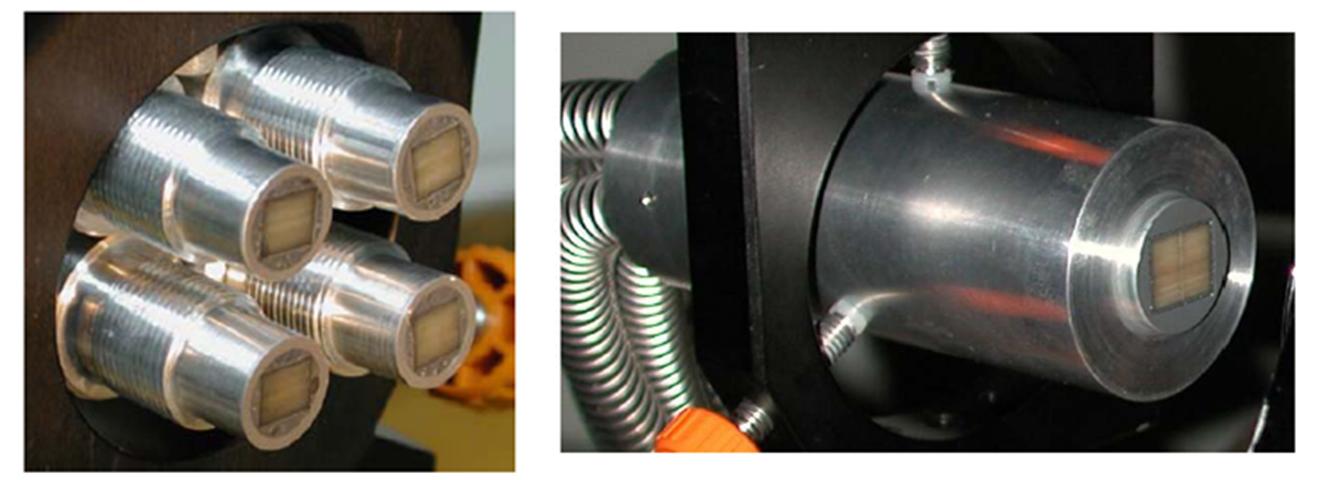
The input ends of the fibre-optic imaging bundles are shown in figure 2(a). Each bundle arm consists of a matrix of 500×600 optical fibres each with a core of 8 µm with the centres separated by 10 µm. At the distal end, shown in figure 2(b), the fibre bundles are combined to form a composite matrix of 1000×1200 optical fibres.
(a) (b)
Figure 2 The input ends of the fibre-optic imaging bundles (a) and the fibre bundle distal end where the fibres are joined to form a composite array (b).
Image dewarping
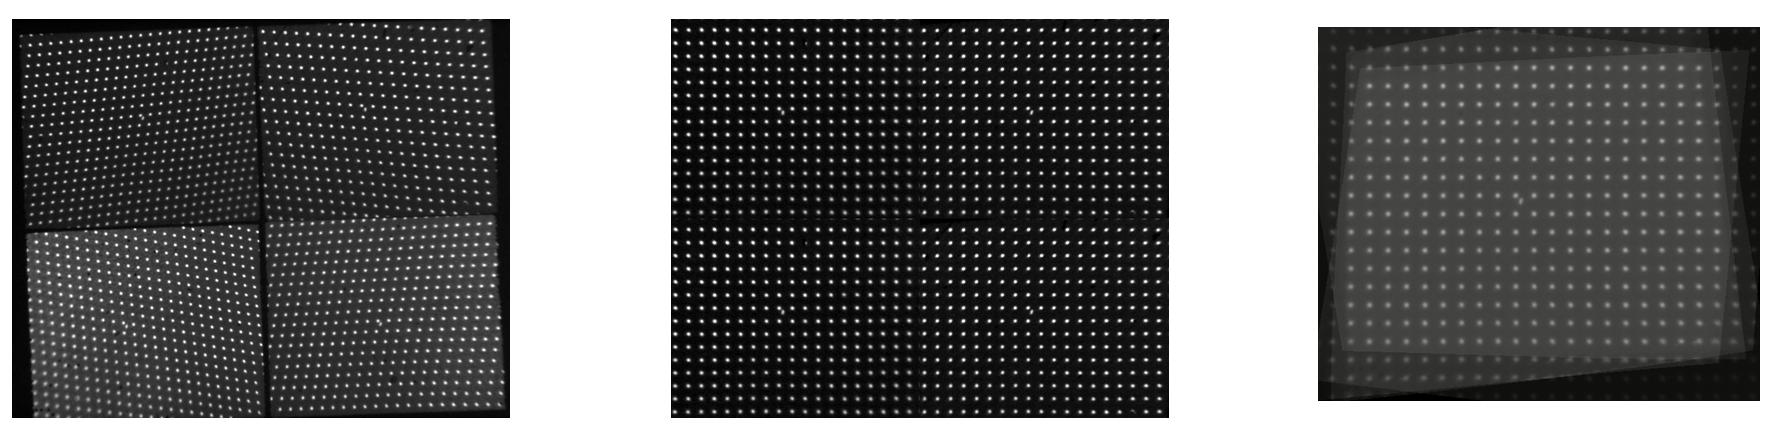
Since each of the views is oriented at an angle to the object, the measurements made with the system are subject to error due to perspective distortion. An image dewarping algorithm is therefore used to correct for this. The dewarping algorithm is also used to align each of the four views to sub-pixel accuracy. The system is calibrated by placing a dewarping target consisting of an array of dots in the object plane of the four camera lenses. Figure 3(a) shows an image of the calibration target viewed through the fibre bundles. After dewarping, the views of the dot array appear as though viewed perpendicularly, as shown in figure 3(b). The four dewarped views are shown overlaid in figure 3(c) illustrating the alignment between the images.
(a) (b) (c)
Figure 3 Image of a dewarping calibration target viewed through the imaging fibre bundles (a). The images from each view after the application of the dewarping algorithm (b). The four dewarped views overlaid (c).
Static measurements from a flat plate
Wrapped phase maps obtained with the multiple-observation-direction shearography system with shear applied in the x direction are shown in figure 4. The images were obtained after a point out-of-plane displacement in the centre of a perimeter clamped flat plate. The magnitude of the displacement was of the order of a few µm. The field of view within each image quadrant is approximately 60×80 mm on the object’s surface. These phase measurements were using temporal phase stepping through the use of PZT mounted mirror in one of the interferometer arms. These images were processed with an iterative sine-cosine filter to remove high frequency noise. The regions of high fringe density vertically through the centre of figure 4 are due to interference of light from different measurement channels and are a consequence of the image shearing.
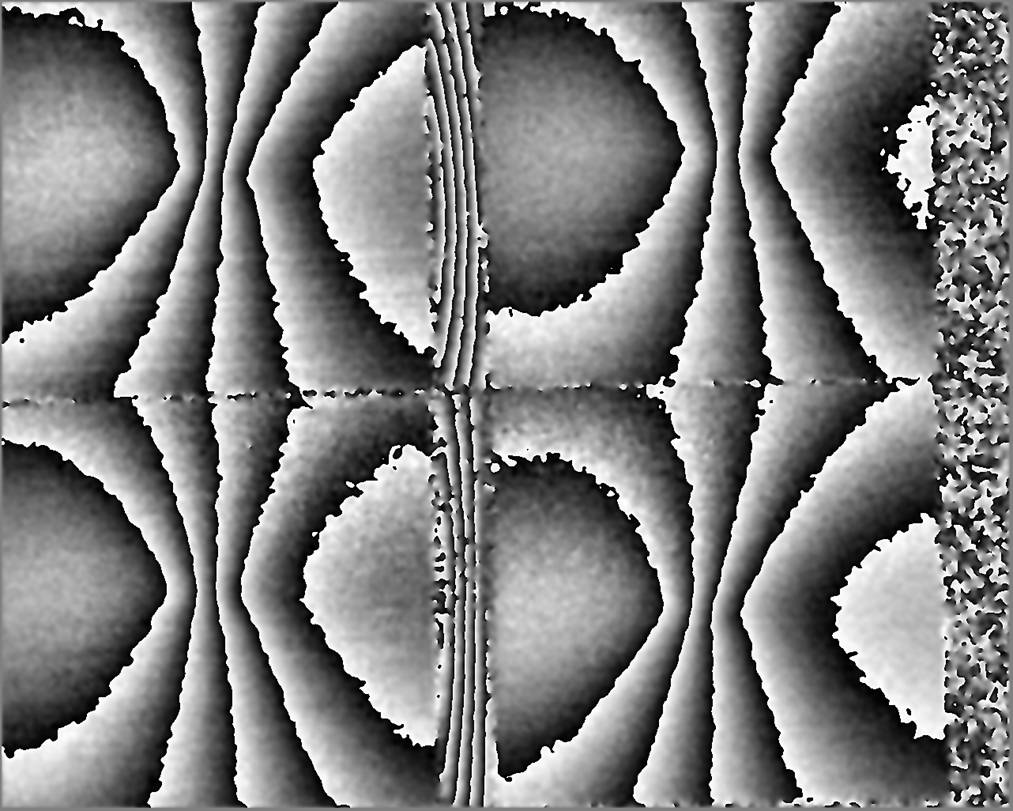 Figure 4 Wrapped phase maps from the four measurement channels obtained with shear applied in the x-direction.
Phase analysis when making dynamic measurements
For statically loaded test objects, temporal phase stepping is a simple and effective technique for calculating the strain induced phase variation, as shown above. However, due to the time required to capture the necessary frames, it is not suitable for dynamic measurements, since all the data needs to be acquired in a single frame. An alternative technique, known as the carrier technique, is often used in these situations and can be implemented in shearography through the use of a Mach-Zehnder interferometer. The principle is illustrated in figure 5. Applying a tilt between the interfering beams introduces an additional phase variation between them.
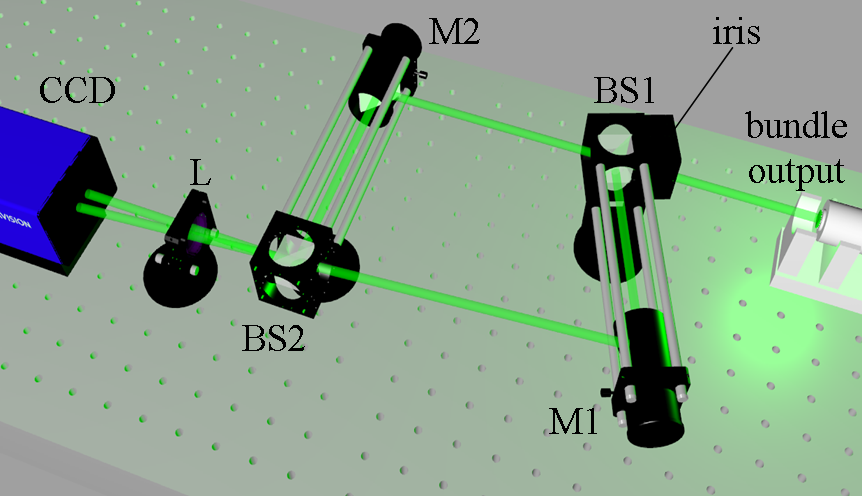
Figure 5 A Mach-Zehnder interferometer used to introduce a frequency variation across the image formed from the interfering beams. M = mirror, BS = beamsplitter, L = lens.
This serves to shift the desired phase data to higher spatial frequencies which can be accessed using Fourier techniques. However, this is only possible if the speckle size is large enough to carry the tilt induced phase fringes. The speckle size can be increased by placing an small aperture (typically < 1mm) within the interferometer. Unfortunately this cuts down a lot of light however, the pulsed laser is powerful enough to be able to tolerate this. Figure 6(a) shows a typical speckle pattern recorded with this configuration, with a magnified region in figure 6(b) showing the carrier fringes. Figure 6(c) shows the Fourier transform of figure 6(a), which has three features. The central background feature and the conjugate phase dependent features to the left and right which contain the desired information.
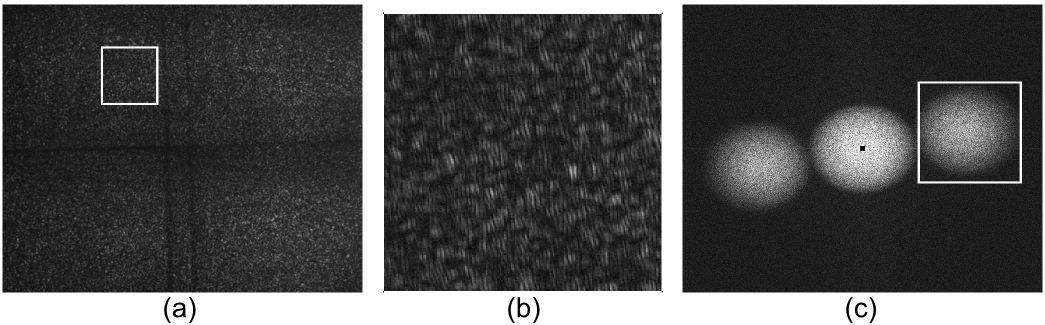
Figure 5 Sheared speckle patterns recorded through the imaging bundles and Mach-Zehnder interferometer (a). A magnified region (indicated by the white box in (a)) showing the fine fringe pattern formed by the introduction of the carrier frequency (b). The magnitude of the Fourier transform of (a) with the phase dependent side feature to be isolated in the calculation indicated by the white box (c).
To calculate the wrapped phase map one of the side features is isolated (as indicated by the white box in figure 5(c)) in two images recorded consecutively after enough time has passed to allow sufficient strain variation. This will depend on the nature of the strain or vibration. The arctan of the real and imaginary parts is taken and the two are correlated to yield the wrapped phase map.
Measurements from a thermally loaded rotating test object
The dynamic measurement capability of the system was tested using a rotating object that was heated to induce a strain variation, which slows as the object cools. The object is a metal disk embedded in a PTFE plate which is mounted on a lathe. The lathe rotates and is synced with the laser so that the object is illuminated at exactly the same point on each rotation. The camera is synced to the laser so that images are acquired whenever the object is illuminated. Pairs of images are processed to produces wrapped phase maps using the carrier technique described above. Figure 7 shows typical phase measurements made with shear applied in the x-direction.
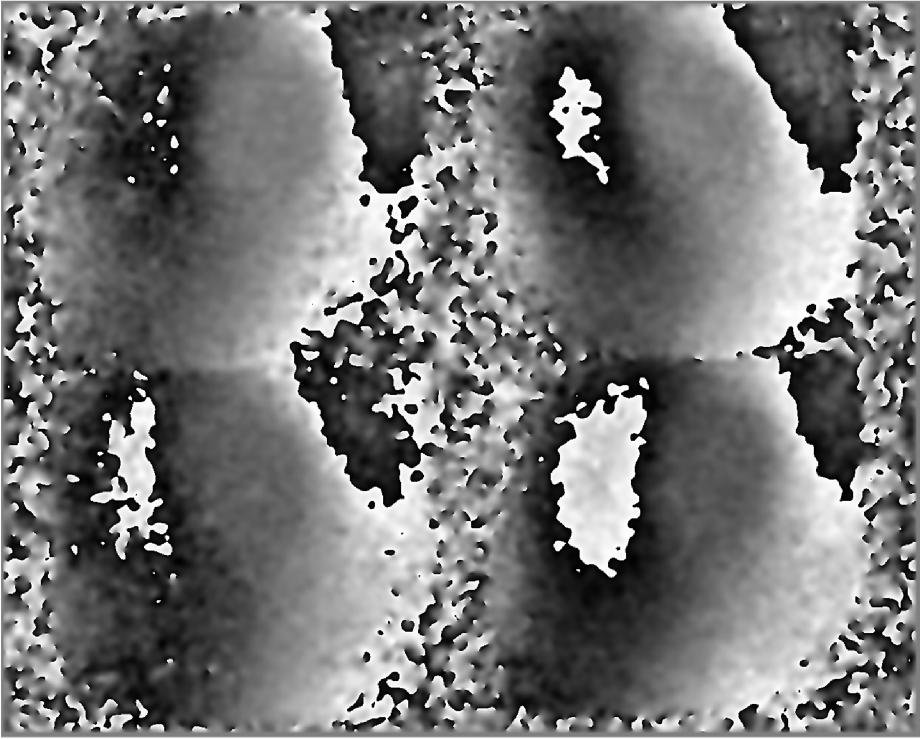
Figure 7 Wrapped phase maps recorded through the imaging bundles and Mach-Zehnder interferometer obtained from a PTFE plate rotating at ~10 Hz (600 rpm). The strain variation was induced by thermally loading a metal disk embedded in the plate.
Figure 8 shows multicomponent strain measurements calculated from phase maps obtained with shear aligned in the x and y directions sequentially. In this example, the thermally induced strain variation is fairly slow, which allows it to be measured using a single pulsed laser with a 10Hz repetition rate. For much faster dynamic events, such as high frequency vibrations or high velocity impacts, two pulsed laser are often used whose outputs can be accurately controlled to reduce the time difference between the exposures to the order of microseconds.
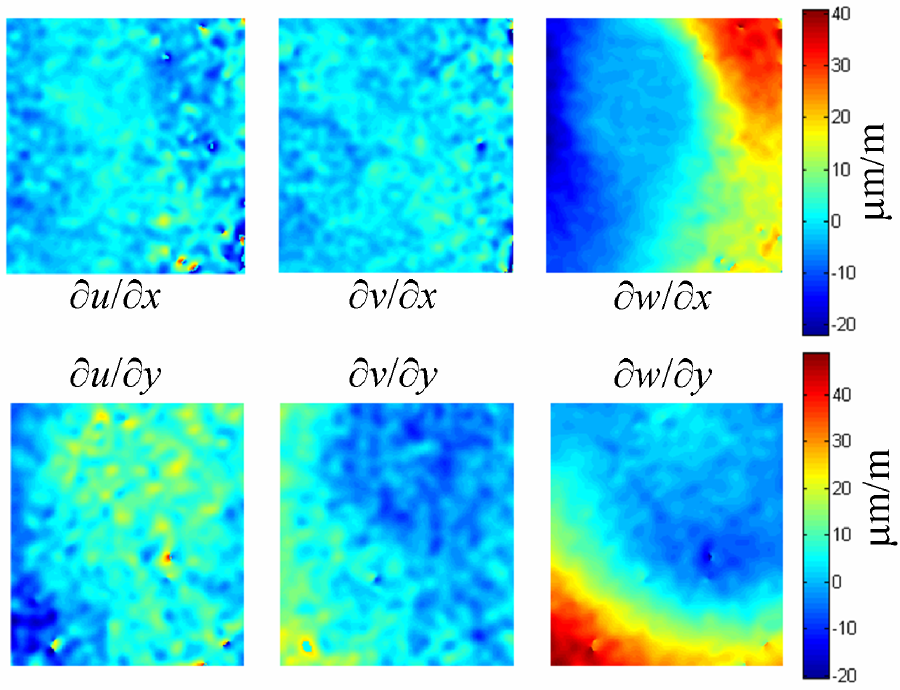
Figure 8 Quantitative surface strain measurements made from a PTFE plate rotating at ~10 Hz (600 rpm).
Selected publications
Surface strain measurement of rotating objects using pulsed laser shearography with coherent fibre-optic imaging bundles
D Francis, S W James, and R P Tatam
Measurement Science and Technology 19, 105301, 2008
Surface strain measurement using multi-component shearography with coherent fibre-optic imaging bundles
D Francis, S W James and R P Tatam
Measurement Science and Technology 18, pp 3583–3591, 2007
Determination of view vectors from image warping mapping functions
D S Nobes, B Wieneke and R P Tatam
Optical Engineering 43, pp 407-414, 2004
CERES: https://dspace.lib.cranfield.ac.uk/handle/1826/5456
Surface strain measurement using multi-component shearography with fibre-optic imaging bundles
D. Francis, S W James, R P Tatam
Presented at the conference Optical Measurement Systems for Industrial Inspection, part of SPIE’s Optical Metrology Symposium, Munich, June, 2007. Proc SPIE 6616 66162S(1-10), 2007
Multi-component shearography using optical-fibre imaging bundles
R M Groves, S W James and R P Tatam
Proc. SPIE 5144, pp 513-20, 2003