
previous next
Feature of the week in OCT news
9th February 2013
 Our research on adhesive cure monitoring using optical coherence tomography appears as feature of the week in OCT News. The article, which can be read here, describes how image correlation techniques can be applied to OCT images to reveal detail on the curing process.
OCT for NDT
13th-14th February 2013
Helen Ford attended the First International Symposium on Optical Coherence Tomography for Non-Destructive Sensing (OCT4NDT) held Feb 2013, in Linz, Austria. Much of her recent work has focussed on applications outside the biological field, in which OCT is widely used, so this was right up her street. As well as presenting her work she bumped into an old friend and EP alumnus, Dr Sammy Cheung, who is in the front row, six from the left. (Helen is in the 3rd row, second from left)
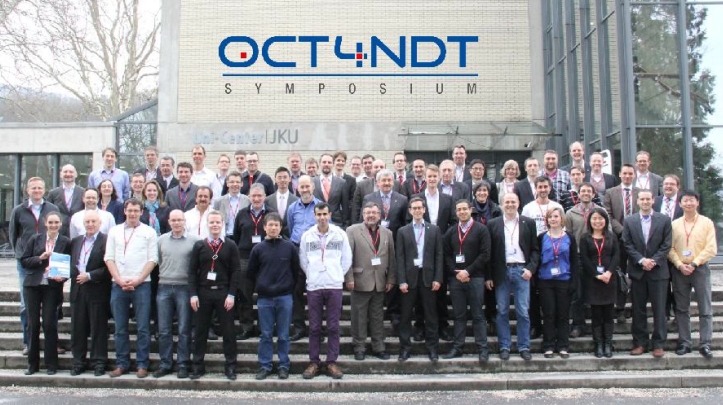
Helen Ford (2nd from left, 3rd row from front) and Sammy Cheung (6th from left, front row) at OCT4NDT.
OCT for Non-Destructive Testing: Surface Profiling and Adhesive Cure Monitoring
H D Ford and R P Tatam
Presented at the First International Symposium on Optical Coherence Tomography for Non-Destructive Sensing (OCT4NDT), Linz, Austria.
Publication Update – Optical Fibre Sensing
22nd September 2013
 Our latest paper, published in the IOP journal Measurement science and technology (http://iopscience.iop.org/0957-0233/) , describes a novel optical signal processing scheme for range-resolved interferometric processing. The scheme originally investigated for applications in LIDAR is applied to a form of optical fibre sensors – Fibre segment interferometry (FSI) – that has the potential to offer very economical, long-gauge length sensors, for the measurement of strain and temperature. In fibre segment interferometry (FSI), consecutive segments of fibre are separated by weakly back reflecting nodes that act as interferometric signal sources. The phase signals from two neighbouring reflectors can be subtracted, resulting in a measurement of the optical path difference (OPD) integrated over the whole length of the fibre segment between the reflectors. In this paper a signal processing scheme that uses code-division multiplexing to separate signal sources and single-sideband (SSB) homodyne signal processing to recover the interferometric phase. The combination of CDM with SSB homodyne signal processing, allows both multiplexing and signal processing to be performed using only a single standard phase modulator with a simple continuous-wave, single-frequency laser diode.
The full paper will be available soon from Measurement science and technology (http://iopscience.iop.org/0957-0233/):
Fibre segment interferometry using code-division multiplexed optical signal processing for strain sensing applications
Thomas Kissinger, Thomas O H Charrett and Ralph P Tatam
Measurement Science and Technology, Vol. 24, p094011 (http://iopscience.iop.org/0957-0233/24/9/094011)
Or via CERES https://dspace.lib.cranfield.ac.uk/ (Cranfield University institutional repository).
COS Reviews: All-fiber multifunction continuous-wave coherent laser radar at 1.55μmm for range, speed, vibration, and wind measurements
30th May 2013 (by John Davenport)
Reviewed by John Davenport and the Cranfield Optics Society.
This paper describes the function of newly developed coherent laser radar (CLR) system and its application to wind measurements, hard target measurements and vibrometry. Along with basic scientific and photonics terminology, the paper assumes the reader is familiar with LIDARoperation. Readers not already familiar with these areas would be advised to check them in advance.
The structure of the paper was good, with well laid out and clear sections. This is particularly valuable as it is relatively long and quite involved. Where equations are used, they are quoted clearly in the text with a table of terms used given part way though. A reader wishing to locate part of the work within the paper would not have difficulty doing so.
Technical details given in this paper is probably its main strength. Full details of how the system was put together are included and a qualified reader is provided with enough information to repeat the work. The results section is broken down into noise analysis, hard target measurements, wind measurements and vibrometry measurements (more on this later). Each is analysed rigorously and concisely. The potential and limitations of the system are clearly stated.
Hard target measurements are taken using a sandblasted aluminium plates, as stationary or moving targets. Over distances or several kilometres, range measurements can be taken with accuracies of a few metres and the line-of-sight component of velocity can be measured to within around 0.1ms-1. Results conform reasonably well to theoretical expectations although there is some uncertainty as to the contribution of turbulence.
Two methods of wind measurements are discussed, using back scattering from a region of air, and focusing onto a single aerosol particle. The former allows measurements to be taken even under clear atmospheric conditions, showing improvements on earlier systems. The second is novel to this study and presents the opportunity for increased sensitivity.
The system is described as ‘multi function’, being about to perform position and velocity measurements of wind, similar measurements on of hard targets, and long range vibrometry measurements. While the first two are clearly different functions, it was our opinion that the vibrometrymeasurements were not fundamentally different from hard target measurements and did not really warrant a separate mention.
To summarise, the paper describes the CLR system, concentrating on technical detail. Details of both construction and testing are presented, describing use for wind measurements and hard target measurements. Layout is clear and easy to follow. This paper is recommended for readers wishing to work with CLR or LIDAR systems or wishing to understand what they are capable of.
“Engineering optics, from bench top to bedside”
20th March 2013 (by Matthew Partridge)
The head of our department organised a talk yesterday by Bruce Tromberg. Bruce Tromberg is professor of Biomedical Engineering; professor (jointly) of the School of Medicine at the University of California, Irvine; and a Director of the Beckman Laser Institute. Additionally, he is also…. okay, I’m going to stop there as I’ve just found his CV posted on his homepage and it runs to 59 pages and I only wanted to write a 1000 word article. I think you can take it for granted that Professor Tromberg is very much at the bleeding edge of optics and is highly respected for his work in the application of optical techniques. If you’d like to know more you can visit his wikipedia page. (yes, he has a wikipedia page!)
Professor Tromberg’s original talk was to be focused on “Medical Imaging in Thick Tissues Using Diffuse Optics” – a field that is one of many focuses of his group’s work at UCIrvine. However, when he was discussing the current activities of our group on his way into the University, he decided that actually we would most likely enjoy a broader talk which focused on numerous applications of photonics. So about 2 hours before he was due to give the talk, he re-wrote the presentation (by combining a few others, I assume…) and made us a whole new one and a half hour presentation on “Engineering Optics – from bench top to bedside”. Below are my notes on this talk.
———————————————————————–
Professor Tromberg’s first degree is in chemistry but his career has ended up moving him more towards photonics and medical applications. In addition to his many other roles, he is a professor of surgery (non-practicing) and has very close ties to active medical groups. His group is part of the Beckman Foundation and consists of around 20 faculty and ~120 researchers. The Beckman foundation is a group aimed at promoting research in chemistry and the life sciences, with a focus on developing new and innovated instruments and materials, as well as supporting young researchers – you can read more here.
Currently, a number of medical imaging technologies work on the principle of bringing the patient to the device. This can be seen for CAT scans and MRIs – both of which have a very high initial capital cost, high running costs and require skilled and often dedicated operators. The ideal model for future systems is to move from this patient-to-technology model and develop devices that can be used in a wider range of settings at the point of care (e.g. at home or in local clinics). Current working examples of photonics being used to promote this move to point-of-care include simple things such as smart phone apps that are capable of accurately recording your pulse.
NOTE: I had heard of these heart rate apps before but I had assumed they were one of many scam/hoax apps on the phone and wouldn’t be any good. However, after Professor Tromberg’s talk we downloaded one and tried it out and found them to be very accurate. I strongly recommend that you download one and give it a go (links to the apps we used are: iPhone or Android).
Other examples of enabling technologies derived from photonics, range from the now very common LASIK to the more recent use of optical coherence tomography to study and understand conditions of the eye.
The next phase in the exploitation of photonics is further into the field of diagnostics and using photonics systems to see beneath the surface of the disease. There are a wide range of techniques that can achieve this, ranging from nanoscopy (high resolution but short penetration) to diffuse tomography (deeper penetration at the cost of resolution).
Non-Linear Optical Microscopy
One technique that Professor Tromberg has worked with is using Non-linear Optical Microscopy in a clinical setting. These microscopes use a number of optical effects to image a number of structures within the dermal layers – collagen has a clear second harmonic generation; cells (specifically the NADP and FAD within them) show a florence reaction; structural features tend to be strong scatterers; and finally, lipids can be imaged using a technique known as ‘Coherent anti-stokes ramen spectroscopy’ (CARS). Some of the most striking uses of this technology was in the imaging of suspected lesions within the skin of a patient. In the image below you can clearly see individual cells and the distinctive change in morphology in possible lesions.
These microscopes have now been commercialised and are used in hospitals across the US, and are finding widespread use in looking at a number of biologically relevant structures.
In Vivo Microendoscopy
Also within the UCIrvine group, Professor Zhongpin Chen has been at the forefront of the use of a number of in vivo optical techniques which allow for the imaging of internal lumens (e.g. airways and blood vessels). The combination of OCT and ultrasound allow for the building up of a complex 3D picture of the walls around the vessel and in the case of blood vessels, the build up of plaque. This technique is allowing doctors, for the first time, to accurately image regions ahead of stent implant surgery and subsequent monitoring of possible re-growth around the stent.
This kind of OCT imaging can also be used to create 3D maps of blood vessels using doppler OCT. This technique relies on calculating the correlation between multiple images to show the moving areas within a depth of around 5mm.
In vivo macroscopic imaging
This area of photonics imaging can be considered the domain of wide field cameras. This kind of imaging is often works by analysing reflected light from the surface of the skin over a wide area using one or more specialist illumination methods. Spatial frequency domain imaging (SFDI) is one such technique that is being used by surgeons within the Beckman Institute and uses a similar method to the Microsoft Kinect system for the xbox 360 – it projects a series of lines in the IR range on to the subject and then alters the frequency of these lines. Using the reflected data, it is then possible to build up a map of the underlying blood vessel structures to a result with low resolution (~5mm). In addition to the structure it is also possible to derive the concentration of oxygenated haemoglobin which is highly significant for a number of clinical applications.
Despite the relatively low resolution, this system is being used by surgeons to determine the blood oxygenation of tissues during surgery. If for example, a flap of skin that is being manipulated during surgery looses too much oxygen supply, it may cause complications in future recovery. By monitoring a live image of the oxygenation of that tissue, the surgeon can see what further action needs to be taken.
NOTE: Professor Tromberg showed an excellent movie of this being used mid-operation however, it didn’t transfer over correctly so I can’t include it in this post.
This kind of macroscopic imaging is also being used along with fluorescent tags in cancer surgery to identify the lymph nodes within the patient. Traditionally, this was done using blue dye injected into the patient and visually tracked by the surgeon. However, this process can be error prone and deeper lymph nodes can be missed. The use of macroscopic imaging techniques can improve this by showing the surgeon the movement of the dye through a number of possibly hidden structures.
Diffuse optics
Finally, Professor Tromberg talked about the use of optical techniques to examine biologically relevant information from a large area with diffused light sources. An excellent example of this being put in to practice is the use of NIR blood oxygen monitoring before and during surgery to improve survival rates and to identify high risk patients. This technology has now also been expanded to monitor patient reaction to common anaesthetics and provide a wealth of new insight into how they can influence patent recovery.
Diffuse optics are also proving vital in breast cancer screening for patients with dense mammary tissue that is difficult to resolve in routine screening procedures. These techniques help separate the higher risk patients and prevent either unnecessary biopsies or missed diagnosis. Also like the monitoring of blood oxygen levels these diffuse techniques can be used to provide constant monitoring to asses the patient’s state and reaction to chemotherapy medication providing new insight for the clinicians treating the tumour.
Summing up
Professor Tromberg’s concluding remarks were that the work his group has undertaken would not have been possible without the links to other fields which provide insight into application requirements. Having researchers that are trained in both photonics and healthcare, has been vital to developing novel techniques to solve long standing medical problems that wouldn’t otherwise be apparent to people specialising in only photonics. He again re-iterated this in answer to Dr James’ question at the end of the lecture, regarding how to manage cross-discipline projects – “Ideally you need a dedicated SWAT team that can find applications for techniques you work with. A mixed team is vital is developing those technologies further”.
COS Reviews; Junction and carrier temperature measurements in deep-ultraviolet light-emitting diodes using three different methods
16th January 2013 (by Mark Manders)
The Cranfield Optics Society (COS) was setup to enable its members to develop the skills and attributes required by researchers. To that end we regularly meet and discuss papers that are relevant to the work we do, and analyse them as a group. The papers are discussed on their clarity, their relevance to our work and their accuracy. Presenting research in the context of a paper is tricky; you strive to make the paper as accurate to the research you undertook while making it as brief as possible. You want it to be unambiguous and to allow others to replicate your work successfully, and therefore validate the usefulness of your research. To know how you should present your work, you need to understand how others have presented theirs and what you found beneficial in that format, and what needs to be improved.
The first paper that we are describing on the blog is; “Junction and carrier temperature measurements in deep-ultraviolet light-emitting diodes using three different methods” by Y.Xi, J.-Q. Xi, Th.Gessmann, J.M. Shah, J.K. Kim, E. F. Schubert, A.J. Fischer, M.H. Crawford, K.H.A Bogart and A.A. Allerman. This paper was published in Applied Physics Letters 86 in 2005. We choose this paper due to its relevance to the research that takes place in our department. LEDs are widely used in gas sensing, however their spectral properties and intensity can vary with temperature. The photonics department is broad in the range of research it does, but much of the equipment used is the same from experiment to experiment.

The structure of the paper follows the traditional pattern of papers; Introduction, Theory, Method, Results and Conclusion. The sections aren’t delineated in the paper but flow as one continuous series of statements. I found this made it difficult at first to absorb the information, but this was a problem not shared by other members of COS. The Introduction in this case gave the background history of ultraviolet LEDs and why junction and carrier temperature are important. The introduction was concise, informative, gave quantified values of the power and wavelength of diodes produced by other groups and named methods used by other groups to measure junction and carrier temperature. This isn’t my field of study and I found the introduction useful. It provided enough information for me to read the paper and have a grasp of the context while having enough specific points that I could look them up for more detailed information on the area. It also explained the importance of junction temperature in short, not enough to fully understand the scope of its importance. It can be assumed that a potential reader would find it important, otherwise they wouldn’t be reading the paper.
The theory section covered the mathematical derivation for the temperature coefficient of the forward voltage. This is required to understand the methods employed to measure the temperatures of the junction and carriers. The derivation flows naturally and produces a valid result that is directly applicable to the work that is done. It is here that we come to the major problem of the paper, lack of description in regards to errors. This section states the temperature coefficient of the forward voltage for GaN diodes that is derived from the equation and from experimentation. What it doesn’t state is the error inherent in both and states that they are in good agreement. The theoretically derived value is -1.76mV/K and the experimentally derived value is -2.3mV/K. The errors for each value are clearly different as they have different numbers of significant figures, that is the only things I can ascertain about the uncertainty.
The method is broken into three parts, one for each of the different approaches used to gauge the temperatures. The description of the method is concise and quite descriptive. The controls in the experiment are well described; including how the diodes were constructed to give some minor information on how to repeat the work. The graphs in results are clear and have all the required information except error bars. The temperature coefficient of the forward voltage is stated for one of the diodes and what its theoretical value should be (-5.8mV/K and -2.04mV/K respectively) but since there is no error stated for either, it is hard to grasp how bad the disparity between them is. There is a good description of why they think there is a disparity but it isn’t quantified. It seems harsh to repeat the point but only figure 3 has error bars on it and for only one line. It is below figure 3 that there is a discussion on the errors in the results, where two methods are found to be in good agreement due to the large errors in one of the measurements.
In the final part of the results they discuss another of their controls, they tried the experiment with different heat sinks. This is a quite a useful comparison to use since it covers the effects of thermal transport in the experiment. The conclusion covers the key points of the paper; the most accurate method of measuring temperature and its error. Overall the paper is well written, it does contain all the necessary information that is summated in the conclusion. It should also be reliable due to the number of controls they state they use to arrive at their conclusion.