
Two-Frequency Planar Doppler Velocimetry (2$$\nu$$-PDV)
Theory
Two-Frequency PDV is a modified PDV technique that reduces the equipment needed to a single camera and iodine cell to measure all three components of the velocity. In the 2$$\nu$$-PDV technique the signal and reference images are acquired sequentially, on the same CCD camera by using two illumination frequencies. These are tuned to different positions on the absorption slope of Iodine.
There are two approaches to the positioning of the illuminations frequencies relative to the iodine absorption line.
In the first a signal and reference image are captured similar to conventional PDV. The first illumination frequency is tuned just off the low frequency side of an absorption line to lie in a 100% transmission region of the iodine transfer function (Figure 1, point A). A reference image is then acquired. The second illumination frequency is positioned at approximately midway (50%) on the iodine cell transfer function (Figure 1, point B), and a signal image is acquired. The two images can then be processed as in conventional PDV, by dividing the two images to produce a normalised transmission image that is then used to calculate the frequency, Doppler shift and finally the velocity.
The second approach increases the sensitivity of the system by tuning the two frequencies to the positions shown as B and C in figure 1. With one source tuned onto the falling slope and the other on the rising slope, a constant Doppler shift will result in the further attenuation of one image to a lower signal level and the rise in the signal level in the other image. Dividing the difference of the images by the sum, and taking into account any difference in the gradients will give a result that has approximately double the sensitivity of the normal PDV.
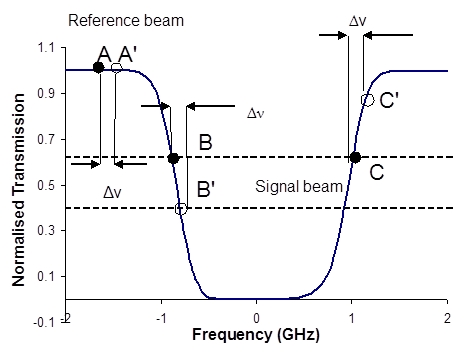 Figure 1 Relative positions of the laser frequency and the shifted frequency on a typical absorption feature for 2$$\nu$$-PDV. (A and B/C denote the position of the illumination frequencies and A’ and B’/C’ the Doppler shifted frequency).
Time averaged 2$$\nu$$-PDV system
A 2$$\nu$$-PDV system capable of making time-averaged velocity measurements has been demonstrated at Cranfield, using a tuneable CW Argon ion laser (Spectra Physics Beamlok 2060). This is fitted with a temperature-stabilized etalon to ensure single mode operation at 514.5nm. A combination of acousto-optic modulators were used to shift the output frequency of the laser and produce the two illuminating frequencies required (shown in Figure 2).
The fundamental laser beam passes first through a half-wave plate to adjust the polarization azimuth and then through an acousto-optic modulator, (AOM1). When AOM1 is switched on, Figure 2 (a), the second order beam experiences a frequency shift of 170 MHz and is deflected through twice the Bragg angle. Beam steering optics then redirect this beam into a position from which it can be coupled into a multimode optical fibre. The second half-wave plate, orientated so as to rotate the polarization azimuth through 90o, is necessary to achieve reflection of the beam at the polarizing beam splitter cube (PBS).
Conversely, when AOM1 is switched off, Figure 2(b), the signal beam is generated. The fundamental laser beam passes through with no frequency shift or angular deflection, and is incident upon a second mirror, which directs it into an alternative beam path. The beam passes through the active area of AOM2 and the optical frequency is altered by 260 MHz. The shifted beam is then retro-reflected by a mirror, making a double pass through a quarter wave plate, which rotates the polarization state by 90o. The beam makes a second transit through the AOM2, doubling the optical frequency shift to a total of 520 MHz, and is recombined with the reference beam in the output PBS and coupled into the same optical fibre as the reference beam.
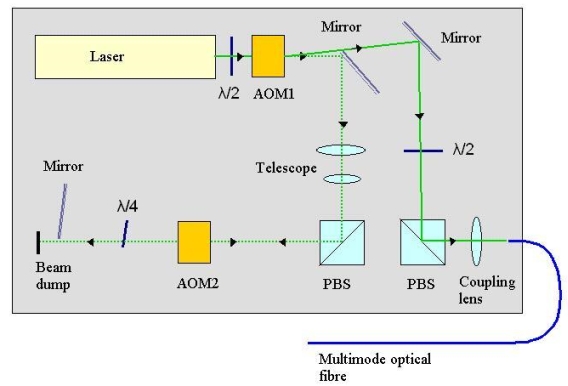
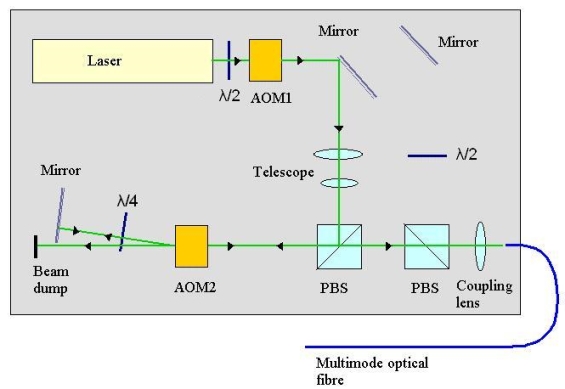 Figure 2 Generation of the two illumination frequencies for the time-average 2$$\nu$$-PDV system.
The velocity field of a seeded air jet
Simultaneous, single velocity component, 2$$\nu$$-PDV and conventional PDV measurements were made on an axis-symmetric air jet in the laboratory. Slices through the jet where measured at various positions downstream from the nozzle, Figure 3 shows the experimental arrangement with the results for both techniques shown in Figure 4.
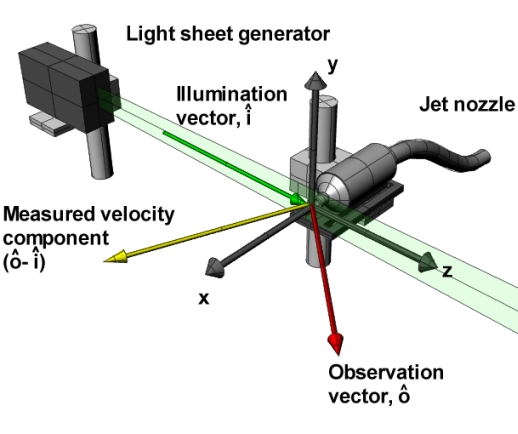
Figure 3 Diagram showing the experimental arrangement for single velocity component measurements on an axis-symmetric air jet.
 (a) (b)
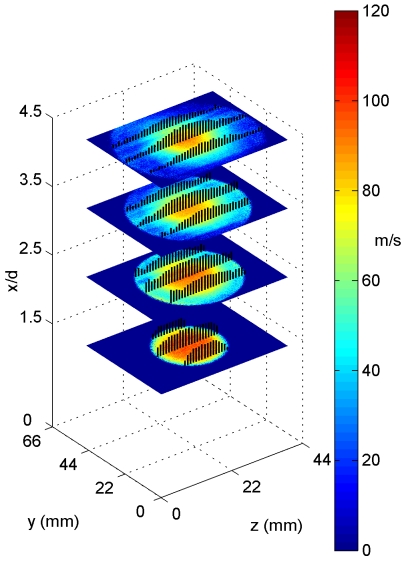
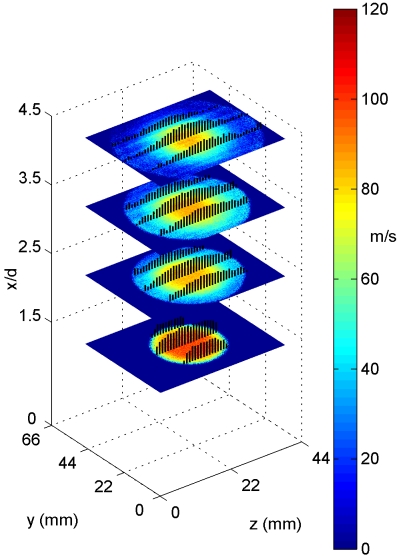
Figure 4 The velocity field of an axisymmetric air jet calculated using (a) the 2$$\nu$$-PDV (single CCD) system and (b) the standard (two CCD) PDV technique. Measurements were taken at 1.5, 2.5, 3.5 and 4.5 diameters downstream from the nozzle. Overlaid are vectors showing the magnitude of the velocity at various points (arrow heads have been removed for clarity).
3D Velocity measurements of a rotating disc
The 2$$\nu$$-PDV technique was combined with the imaging fibre bundles allowing three dimensional velocity measurements to be made using a single CCD camera and iodine cell. Measurements were demonstrated on the velocity field of a rotating disc. This provides a well-defined velocity field with which to characterise the performance of the system. Both frequency tuning schemes, the normal sensitivity (signal/reference) scheme and the increased sensitivity (signal/signal) scheme described above where used and the level of error in the measurements compared.
Figure 5 shows the experimental configuration with four velocity components measured and Figures 6(a) and 6(b) show examples of processed velocity components for each sensitivity scheme. The increased sensitivity measurement is visibly improved compared to the normal sensitivity measurement.
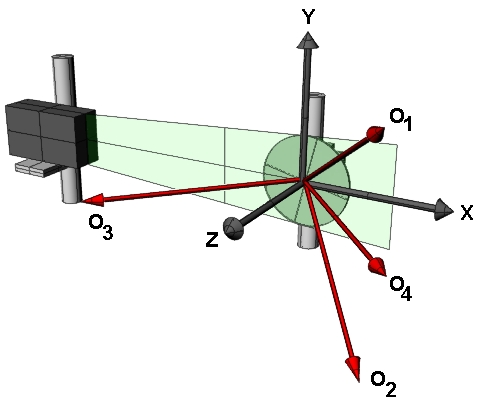
Figure 5 Diagram showing the viewing geometry used when making measurements on the rotating disc. O1, O2, O3 and O4 are the observation directions for each arm of the imaging fibre bundles.
 (a) (b)
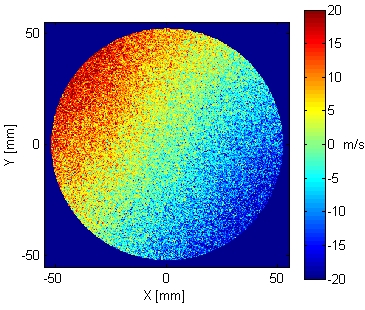
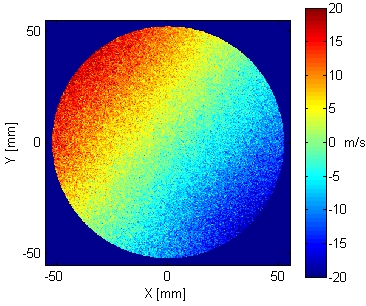
Figure 6 A single measured velocity component of a rotating disc, calculated using the normal sensitivity scheme (a). A single measured velocity component of a rotating disc, calculated using the increased sensitivity scheme (b).
The three measured velocity components are not aligned with an orthogonal co-ordinate system, so it is necessary to perform a transformation to the orthogonal velocity components, U (Horizontal), V (vertical) and W (out-of-plane). These are shown in Figure 7 for both sensitivity schemes, along with a histogram of the remaining error when the theoretical wheel velocity is subtracted. The standard deviation of the remaining error shows an approximately 40% reduction when using the increased sensitivity method.
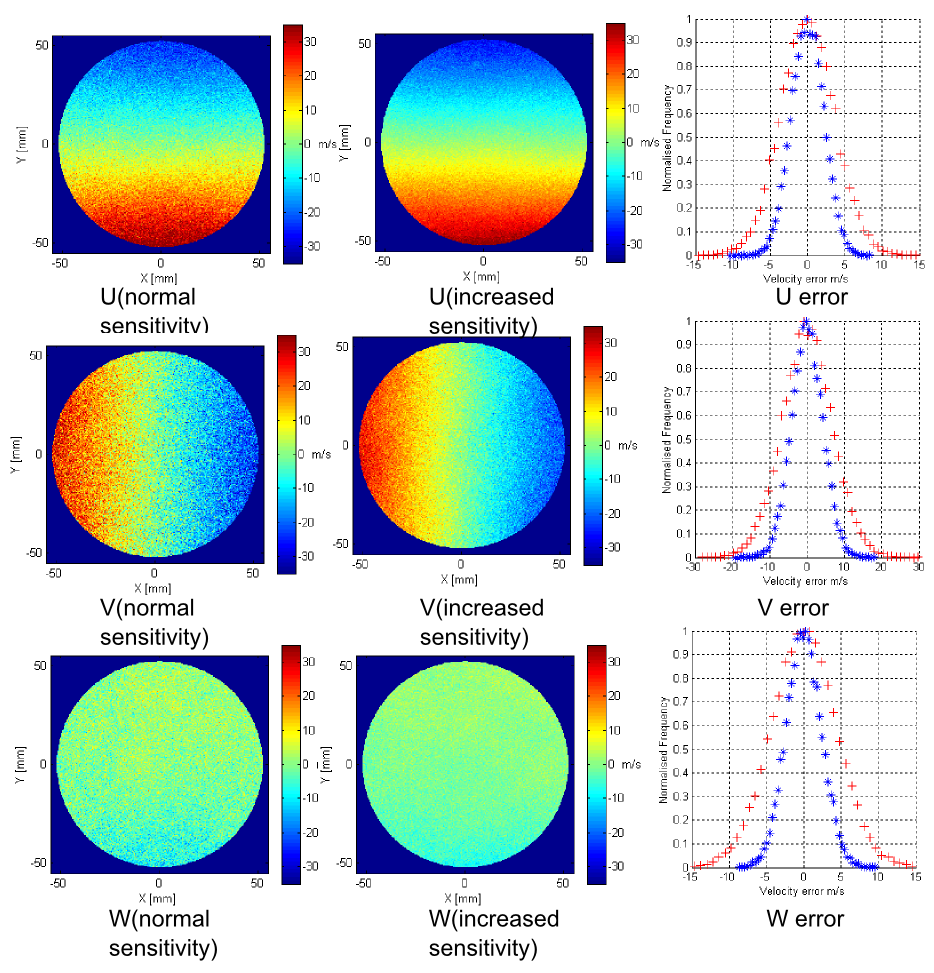
Figure 7 Comparison of computed orthogonal velocity components; (left column) Examples of the calculated orthogonal velocity components using the normal sensitivity 2$$\nu$$-PDV technique; (middle column) Examples of the calculated orthogonal velocity components using the increased sensitivity 2$$\nu$$-PDV technique; (right column) Histograms showing the difference between the measured and theoretical velocity component. + Normal sensitivity 2$$\nu$$-PDV technique. * Increased sensitivity 2$$\nu$$-PDV technique.
3D Velocity measurements on a seeded air jet
The system was then demonstrated on an axisymmetric air jet with a 20mn smooth contraction nozzle this is shown in Figure 8.
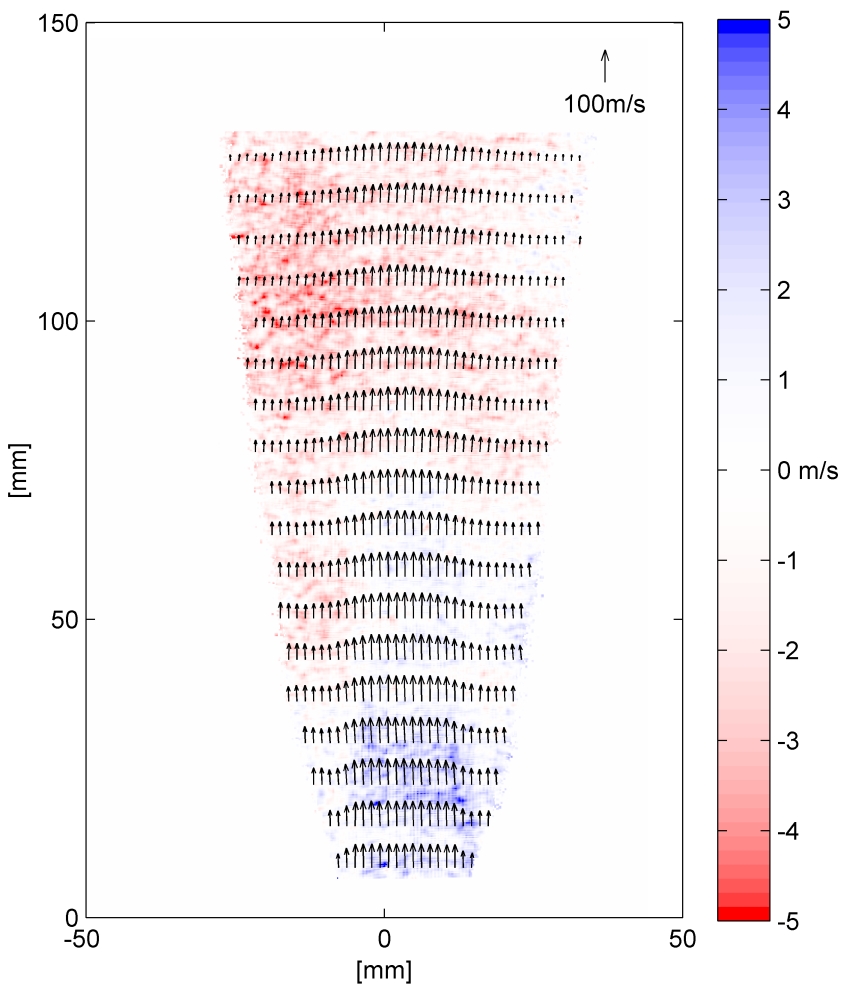
Figure 8 Example of a 3D 2$$\nu$$-PDV measurement made on a seeded air jet. Vectors show the in plane velocities (every 8th and 40th vector show in the horizontal and vertical directions respectively) and colour the out of plane velocity.
References
Single camera three component planar velocity measurements using two frequency planar Doppler velocimetry
T O H Charrett and R P Tatam
Measurement Science and Technology, 17, 1194-1206 (2006) (Special Issue from OFS-17)
CERES: https://dspace.lib.cranfield.ac.uk/handle/1826/5464
Two-frequency planar Doppler velocimetry (2ν-PDV)
T Charrett, H D Ford, D S Nobes and R P Tatam
Review of Scientific Instruments, 75, 4487, 2004
Dual illumination planar Doppler velocimetry using a single camera
T O H Charrett, H D Ford, D S Nobes, R P Tatam
Presented at the SPIE conference Optical Science and Technology, part of the SPIE’s International Symposium on Optical Diagnostics for Fluids, Solids, and Combustion II, San Diego, USA, August 2003.
Presented in the proceedings, 5191, 2003.