
Surface strain measurement using multi-component shearography
Introduction
The component of displacement gradient that a shearography instrument is sensitive to is determined by the sensitivity vector k, which is defined as the bisector of the observation vector ô, and the illumination vector î. This is illustrated in figure 1. The sensitivity vector k is made up of three orthogonal components (kx, ky kz). A shearography fringe pattern will therefore typically contain contributions from the three orthogonal displacement gradient components. To isolate these three components, measurements need to be made from three measurement channels which have three different sensitivity vectors. The measurement channels can be constructed from either multiple illumination directions and a single observation direction or multiple observation directions and a single illumination direction.
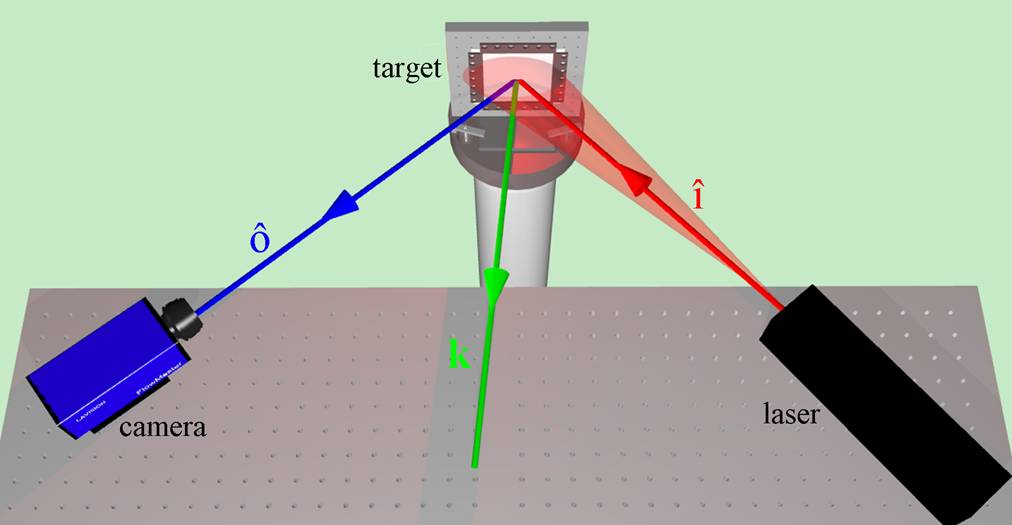
Figure 1 The sensitivity vector k, is defined as the bisector of the observation vector ô, and the illumination vector î.
Figure 2 shows a schematic of a shearography instrument that consists of three illumination directions. The illuminations positions are located at points S1, S2 and S3. The three measurement channels are characterized by the sensitivity vectors k1, k2 and k3. The surface strain of an object can be characterized by six components of displacement gradient. The additional three components can be measured using shearography with the image shear applied in an orthogonal direction.
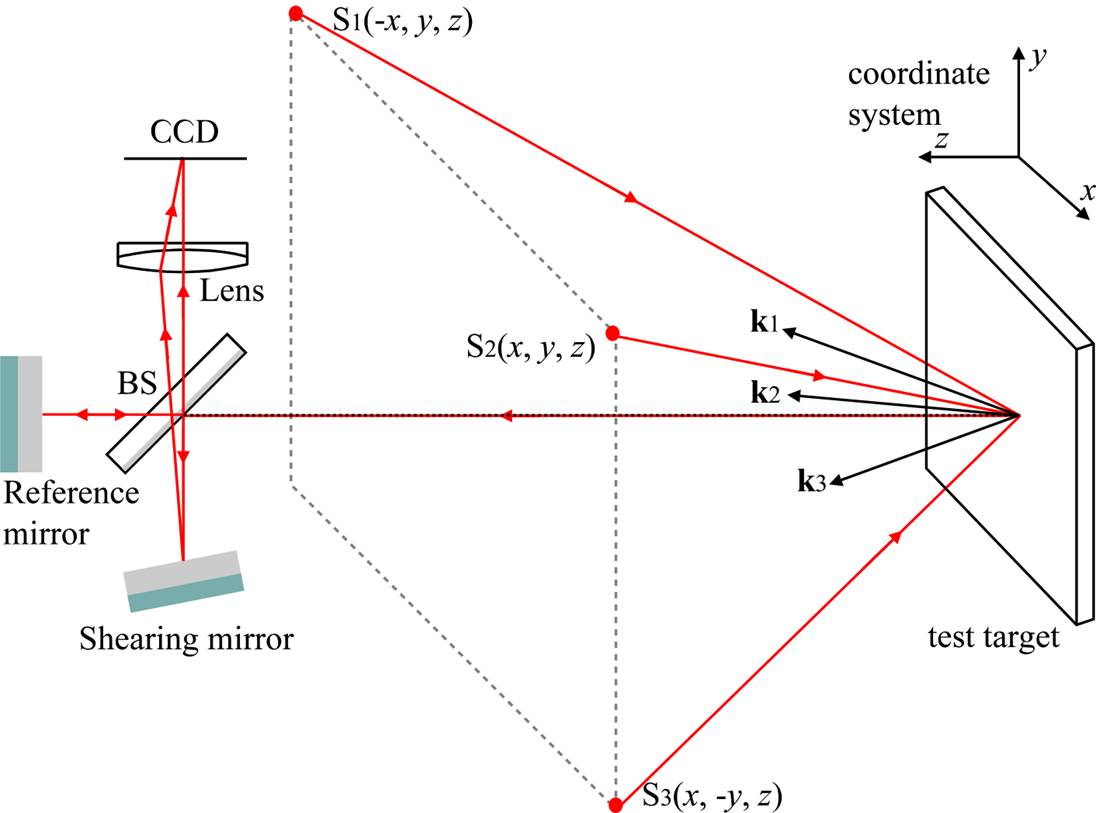
Figure 2 A shearography system with three measurement channels provided by three illumination directions originating from S1, S2 and S3 and a single observation direction. The sensitivity vectors of the three measurement channels are k1, k2 and k3.
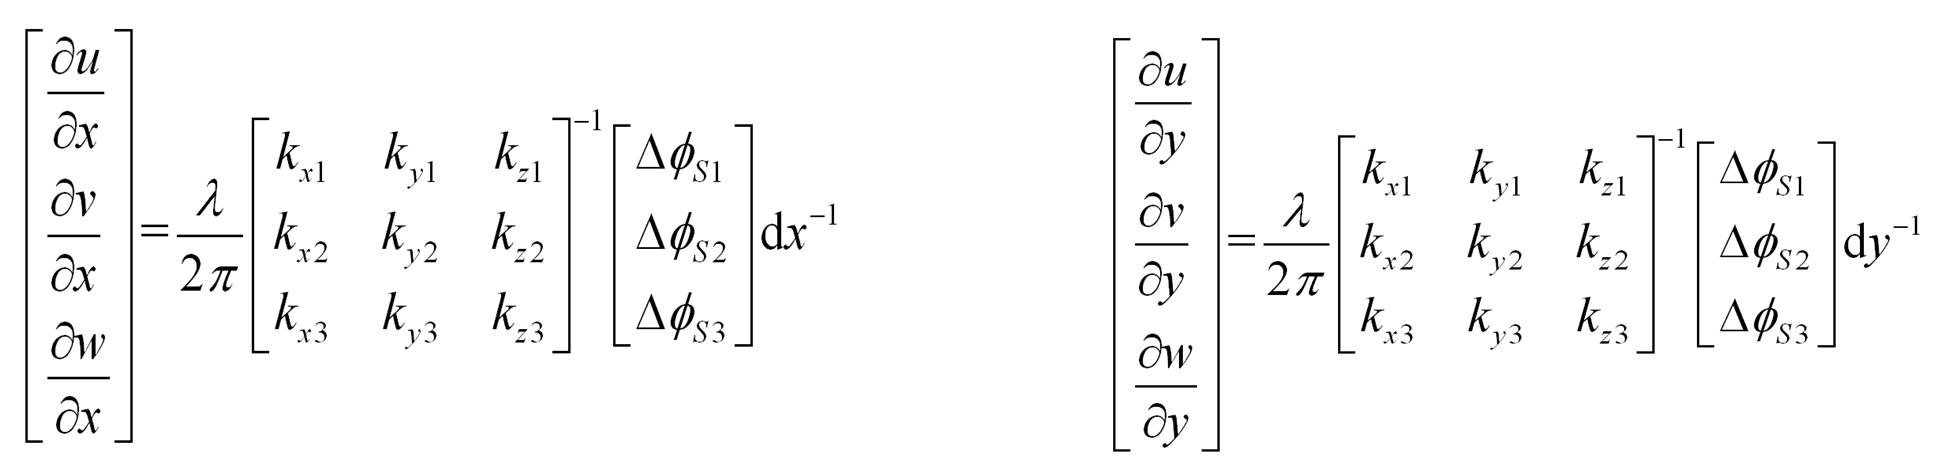
The orthogonal displacement gradient components can be calculated from unwrapped phase measurements made using the three measurement channels using a matrix equation given by the equations below. In these equations dx and dy are the shear magnitudes, λ is the illuminating wavelength and ΔφSi is the phase distribution measured by channel i (i = 1, 2, 3).
Multiple illumination direction shearography
A photograph of the EPG multiple-illumination-direction shearography system is shown in figure 3(a). The shearing interferometer and camera are housed within an aluminium box which is mounted on a tripod. The object is viewed through an aperture in the centre of the box. The light sources are DPSS (diode pumped solid state) lasers with a wavelength of 532 nm which are arranged symmetrically around the central aperture. The illumination modules also hold high magnification microscope objectives which allow a wide divergence to fully illuminate test objects. These are mounted on two axis brackets which allows them to be easily oriented to the desired direction. A photograph of the Michelson shearing interferometer is shown in figure 3(b). The interferometer consists of a beamsplitter, shearing mirror and a reference mirror. The reference mirror is mounted on a piezoelectric transducer (PZT) which is used to shift the phase within the interferometer and enable temporal phase stepping.
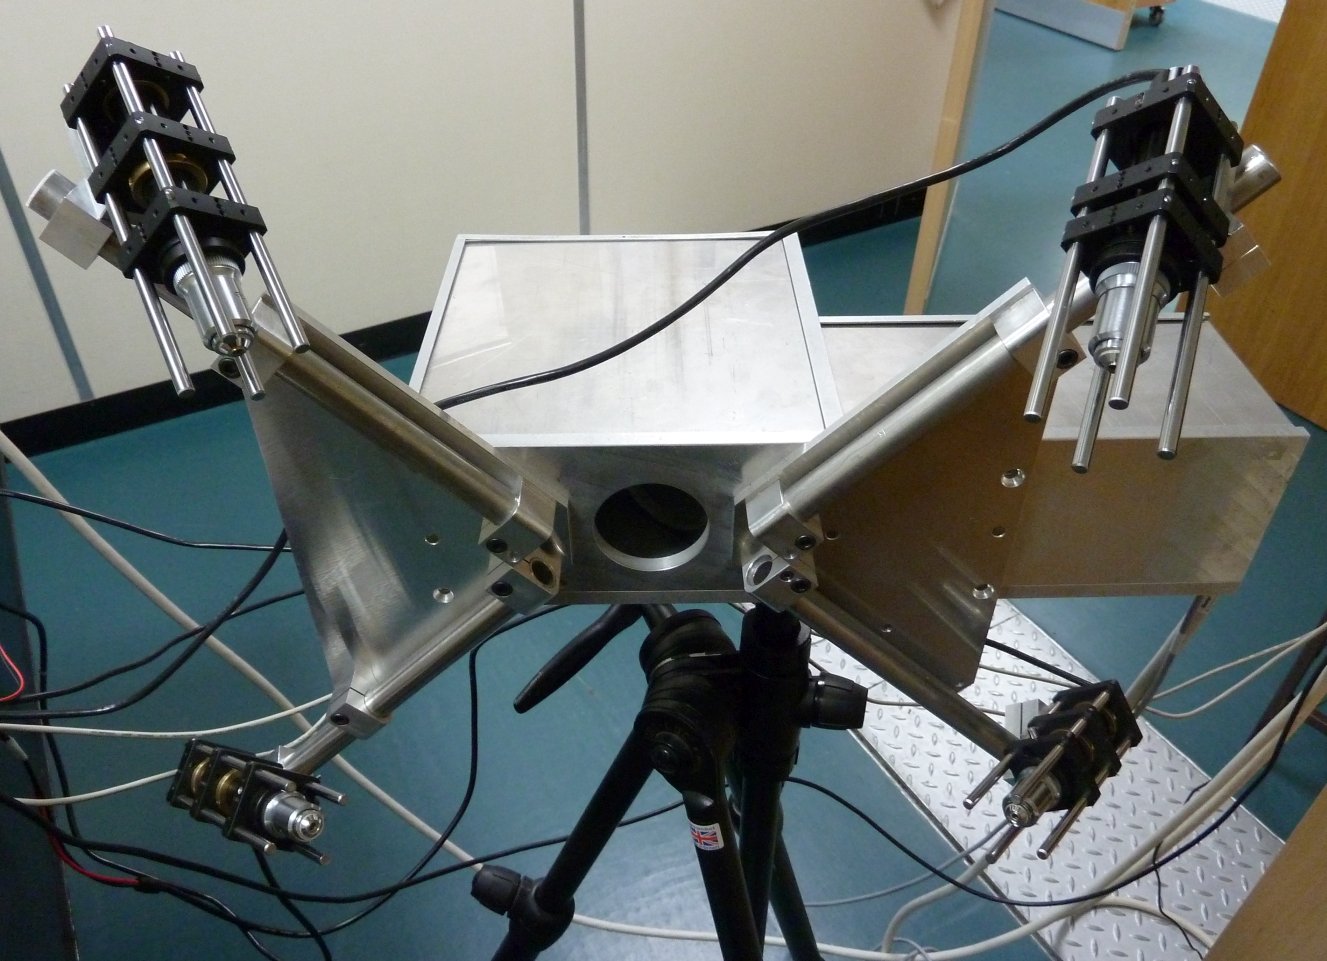
Figure 3a Photograph showing the multiple-illumination-direction shearography system with four laser modules arranged symmetrically around the viewing aperture.

Figure 3b Photograph showing the Michelson interferometer consisting of shearing mirror, phase stepping mirror, beamsplitter and camera.
Surface strain measurement on non-planar objects
The instrument shown in figure 3 has been used for surface strain of statically loaded, non-planar objects. Figure 4 shows wrapped phase maps obtained using the instrument from a hydrostatically loaded cylindrical steel gas main pipe with a radius of 90 mm. Each of the images has a field of view of approximately 55×40 mm on the object’s surface. A weld runs horizontally through the centre of each of the images. The phase measurements were obtained from each of the illumination directions sequentially. Since the object is non-planar, a correction for the object’s shape is required. This was obtained by using the same instrument to measure the object’s slope.
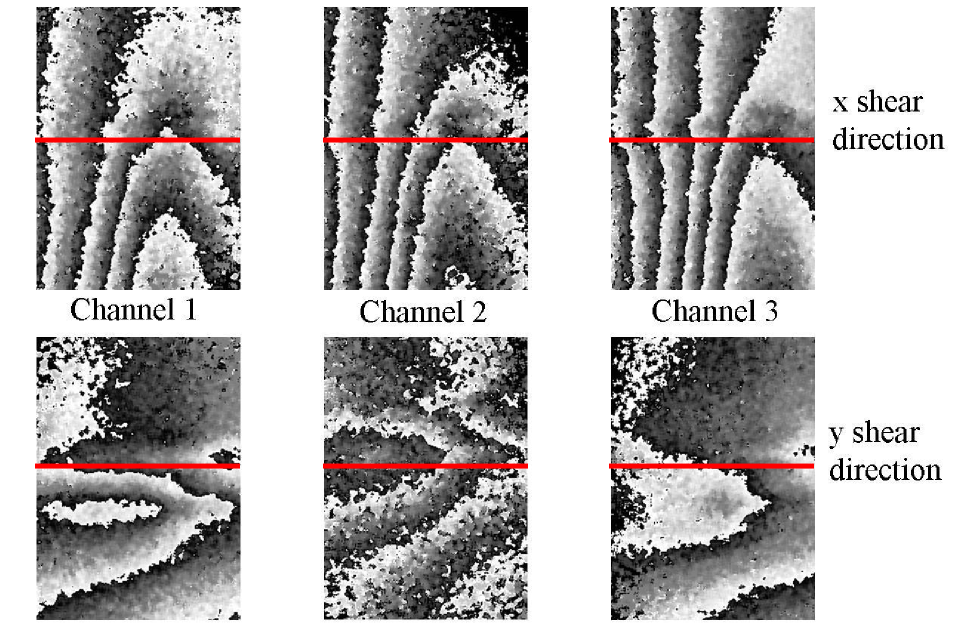
Figure 4 Wrapped phase maps obtained using the multiple-illumination-direction shearography system from a hydrostatically loaded gas main pipe. The weld runs horizontally through the centre of each of the images as indicated by the red line.
Figure 5 shows the orthogonal displacement gradient components which were calculated from the phase measurements shown in figure 4 and measurements of the sensitivity vector across the field of view. The sensitivity vector was calculated from measurements of the observation and illumination positions. The position of the weld is indicated by the white horizontal line.
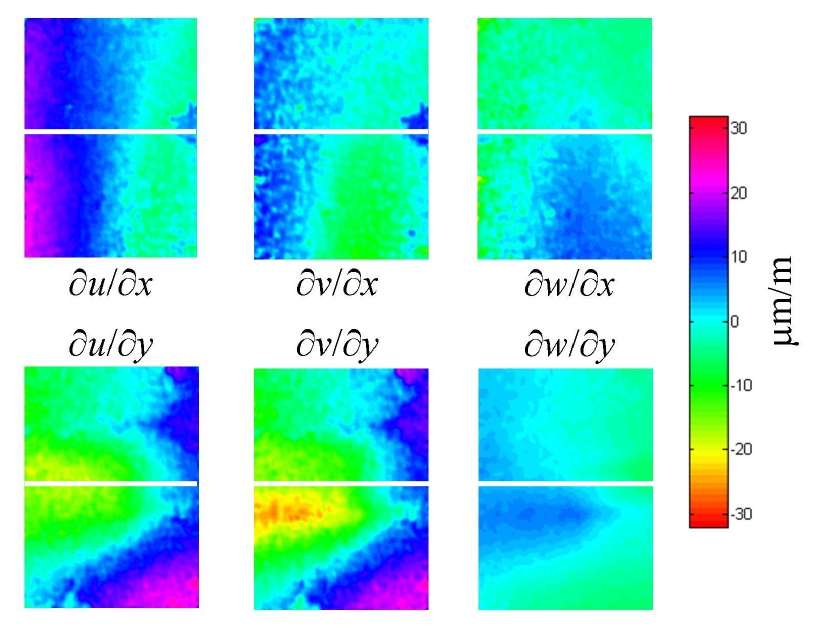
Figure 5 The six orthogonal displacement gradient components calculated using the multiple-illumination-direction shearography system.
Surface strain measurement on non-planar objects
We have also made strain measurements with the multiple-illumination-direction shearography system and compared them with measurements made using resistance foil strain gauges and fibre Bragg gratings. Measurements were performed on a hydrostatically loaded ABS pipe with measurements being made at loading intervals of 69 kPa. Figure 6 shows the wrapped and unwrapped phase maps made using the three measurement channels with shear applied in the x-direction over a field of view of approximately 60×60 mm. Also shown are the ∂u∂/x, ∂v∂/x and ∂w/∂x components of the surface strain. The graph shows the measured strain at loading step for each of the three measurement techniques.

Figure 6 Multi-component shearography measurements showing wrapped and unwrapped phase, and displacement derivative. The chart shows the comparison of strain measurements made with shearography, strain gauges and FBGs over a range of pressure levels of hydrostatically loaded pipe.
Next: Pulsed shearography
Selected publications
Quantitative shearography: error reduction by using more than three measurement channels
T O H Charrett, D Francis, and R P Tatam
Applied Optics, 50, 134-146 (2011)
CERES: https://dspace.lib.cranfield.ac.uk/handle/1826/5066
Surface strain measurement: a comparison of speckle shearing interferometry and optical fibre Bragg gratings with resistance foil strain gauges
R M Groves, E Chehura, W Li, S W James and R P Tatam
Measurement Science and Technology 18, 1175-1184 (2007)
Pipe Weld Investigation using Shearography
R M Groves, S W James and R P Tatam
Strain 39 pp 101-105, 2003
Time-division-multiplexed 3D Shearography
S W James and R P Tatam
Presented at Interferometry ’99 , Poland, 1999. Published in SPIE Proc . 3744 , pp 394-403, 1999.
Full surface strain measurement using shearography
R M Groves, S W James and R P Tatam
Presented at the SPIE conference Optical Diagnostics for Fluids, Solids, and Combustion , San Diego, USA, 2001. Published in SPIE Proc. 4448 , pp142-152, 2001.
Development of Shearography for Surface Strain measurement of non-planar objects
R M Groves
PhD thesis, School of Engineering, Cranfield University, 2001